Options trading with Renko charts can offer a valuable benefit in Options trading. Despite not being time-dependent, Renko charts are quite easy for options trading in markets available on the Options Trading App. However, it's important to have rational expectations, as Renko charts do not provide magical outcomes. In Renko charts, the closing prices based on the selected chart time frame are typically used.
The price information on Renko charts is the same as regular bar charts. Essential factors include trading strategy, base chart time frame, instrument price movements, and risk management.
Renko Charts: An Overview
To know what is Options Chain, you must understand the Renko chart. A Renko chart is a helpful chart for technical analysis highlighting price fluctuations instead of time intervals. Unlike traditional charts, Renko charts are not time-oriented but are driven by price movements.
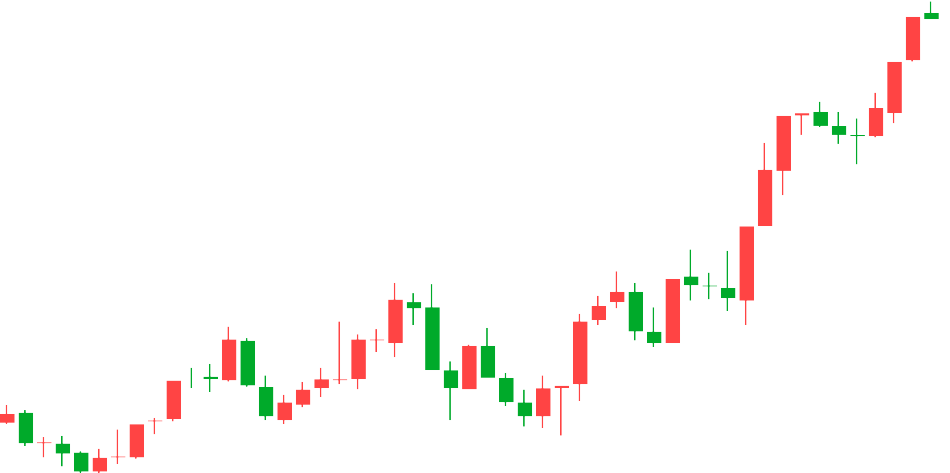
They are constructed by drawing fixed-sized boxes or bricks representing these price changes. Each brick is removed in alignment with the direction of the price movement, and the trader determines its size. The accompanying image depicts a standard Renko chart.
They are constructed by drawing fixed-sized boxes or bricks representing these price changes. Each brick is removed in alignment with the direction of the price movement, and the trader determines its size. The accompanying image depicts a standard Renko chart.
Renko charts offer a simplified and precise demonstration of price fluctuations. It enables traders to spot patterns quickly and determine when to enter or exit trades. This technique is referred to as blocking out unnecessary information.
Additionally, the Renko chart indicator effectively eliminates unwanted noise and market volatility. It disregards minor price variations that may generate misleading indications by displaying only price movements in the Options Chain. It can meet or exceed a specific brick size in the chart.
Additionally, the Renko chart indicator effectively eliminates unwanted noise and market volatility. It disregards minor price variations that may generate misleading indications by displaying only price movements in the Options Chain. It can meet or exceed a specific brick size in the chart.
Working of Renko Chart
In a Renko chart, bricks represent a specified range of price movement called the box size. Traders can choose the brick size, determining when a new brick is formed on the Algo Trading Software. The bricks are arranged at a 45-degree angle from the previous brick and cannot be placed side by side.
Therefore, if the price reverses, it must move double the box size before a new brick is printed in the new direction. Bricks cannot be placed next to each other; a price movement of at least 40 points is required to form a new brick in the opposite direction.

Anything less than this threshold will not print in the form of a new brick in. Renko charts are specifically designed to filter out minor price fluctuations, making it easier for traders to identify significant trends. However, this filtering process comes at the cost of losing certain price information, such as high and low prices. Typically, Renko charts do not display wicks.
Renko chart can incorporate wicks to represent instances where the price briefly crossed the previous brick but was not significant enough to form a new brick before continuing in the current direction.
Renko chart can incorporate wicks to represent instances where the price briefly crossed the previous brick but was not significant enough to form a new brick before continuing in the current direction.
The Process to Use Renko Charts
Initially, you need to access the stock chart available on your trading platform to utilize the Renko chart on a stock chart. To use Renko charts through the Algo trading engine efficiently, it is essential to follow some crucial steps:
Decide the Brick Sizes
The primary step when using Renko charts is to determine the brick size. It represents the minimum price movement required for a new brick to be drawn on the chart. The choice of brick size will depend on various factors, such as your trading style and the asset being traded. It also includes stocks, commodities, F&O, or currency pairs.
If you select the large brick size, you will have fewer bricks on the chart. It makes it easier to identify the trends. While choosing the small brick size, it will result in more bricks. Thus, it offers more trading opportunities.
If you select the large brick size, you will have fewer bricks on the chart. It makes it easier to identify the trends. While choosing the small brick size, it will result in more bricks. Thus, it offers more trading opportunities.
Trend Identification
The next step is to use Renko charts to identify trends. Renko charts are helpful for trend identification because they filter out noise and volatility. To place a movement, one must observe a sequence of bricks that are either all bullish (green) or all bearish (red). Bullish bricks indicate an uptrend, while a series of bearish bricks indicate a downtrend.
Searching the Trading Opportunities
The last step involves identifying trading opportunities. It includes looking for price reversals, where the price moves against the trend, or determining support and resistance levels. These factors indicate entry and exit points.
Trading Strategy with Renko Chart
The Renko chart does not rely on time intervals to determine when bricks are printed. Although the chart includes a time axis, the construction of bricks is not influenced by the passage of time. Instead, the formation of bricks is determined by the magnitude of price movements and the selected size.
Here are some of the effective Options Strategy Builders which can be developed with Renko charts:
Here are some of the effective Options Strategy Builders which can be developed with Renko charts:
👉 Range Trading Strategy
Renko charts are helpful for range trading by identifying breakout opportunities when a range is present. Therefore, traders can effectively integrate Renko charts into their trading strategies. Adjusting the brick size on your chart according to market movements is essential for effectively using Renko charts for range trading. Range trading involves the market fluctuating between specific price levels called support and resistance.
Setting the brick size on your Renko chart appropriately and implementing well-thought-out stop losses and limit orders. You can identify upward or downward trends in the market using the simplicity of Renko charts.
However, the success of this strategy depends on your ability to identify suitable support and resistance levels. If the chosen brick size and range do not align well with the market conditions, range trading might not be as effective.
👉 Brick Size Strategy
One popular technique for identifying market momentum is the trend trading strategy. It involves using Renko charts. In this strategy, the size of the bricks on the Renko chart plays a crucial role. A larger brick size means the underlying market needs to increase the price for a brick to form.
..So, a common Renko strategy is to use a larger brick size. It helps to filter out smaller price fluctuations and focus on significant market movements. However, one limitation of using Renko charts alone is that it is difficult to measure the robustness of a trend in real-time. Traders often have to rely on the duration of a trend, which can be a retrospective approach.
..So, a common Renko strategy is to use a larger brick size. It helps to filter out smaller price fluctuations and focus on significant market movements. However, one limitation of using Renko charts alone is that it is difficult to measure the robustness of a trend in real-time. Traders often have to rely on the duration of a trend, which can be a retrospective approach.
👉 Breakout Strategy
Breakout strategies with Renko charts are exciting because they use block sizes measured by ATR. It is a volatility indicator that is used in breakout trading strategies. This strategy depends on finding support and resistance levels.
However, the main idea here is to display natural figures on the Renko chart to pinpoint when the price breaks out of these levels. The aim is to enter a position early in a new trend and set a stop-loss order at the breakout point.
However, the main idea here is to display natural figures on the Renko chart to pinpoint when the price breaks out of these levels. The aim is to enter a position early in a new trend and set a stop-loss order at the breakout point.
Conclusion
Renko charts are a valuable resource for traders with a unique perspective on market trends. It can help to identify potential trading opportunities available on the Options Trading App. These charts are handy because they filter out irrelevant market noise and highlight essential price movements. As a result, both beginner and experienced traders can benefit from using Renko charts.
One effective strategy is to use stop-loss orders in conjunction with Renko charts. It allows traders to set predetermined exit points for trades if the asset doesn't move in the expected direction. Another essential consideration is diversifying investments by only allocating a portion of available capital to each trade. It can help reduce the risk of significant losses if a single trade doesn't go as planned.
One effective strategy is to use stop-loss orders in conjunction with Renko charts. It allows traders to set predetermined exit points for trades if the asset doesn't move in the expected direction. Another essential consideration is diversifying investments by only allocating a portion of available capital to each trade. It can help reduce the risk of significant losses if a single trade doesn't go as planned.