Studies show that Keeping a good track of Profit-Loss pyramids will help you Perform better with your Options trading. This obviously makes sense & there are 2 Major ways to go about it:
Payoff Graphs
Profit & Loss Diagrams.
So What Exactly Are "Payoffs"?
For example, Your total Investment sum was ₹28,000 over a period of a month of trading. When you closed all the Trade positions on this particular amount invested, You received back a total sum of ₹36,500.
That will make your Net Payoff: ₹36,500 - ₹28,000 = ₹8,500. So option payoffs are basically about How much return you make upon Completion of the time-based Options trading strategy, minus the amount you spent buying the Options.
What Are "Payoff Graphs" in Options Trading?
Payoff graphs are a presentation of the Relation between the Option's spot price & Profit or Loss it will Generate. In options algo trading, it is advisable to Analyze an underlying asset through Payoff graphs before Entering the contract.
The return you get during an Option contract is strictly going to depend on the Varying price movement of the Stock. Depending on the Nature of the option contract, Trader can benefit from both Upwards & Downwards movements.
How "Payoff Graphs" Benefits in Options Trading?
The payoff graph will Help you quickly analyze the Risk profile or Profitability of the Underlying stock. You can use these Graphs to Validate your idea or Trading strategy. Payoff graphs will quickly tell you what Price levels will Give you How much Returns.
The options trading app also shows Payoff graphs for Individual options to assist traders in decision-making. We can get a clear idea of How much the Price has to move up/down for us to make X amount of Profit from Respective option stocks.
What Are "Profit & Loss" Diagrams in Options Trading?
Like Payoff graphs, Profit & Loss diagrams also show the Correlations between Stock price movements and Profit/Loss made. It is a diagrammatic presentation to easily understand the correlation between Stock price movements & Profit/Loss generated.
(Profit & Loss diagrams are abbreviated as P&L diagrams.)
Here's an Example below :
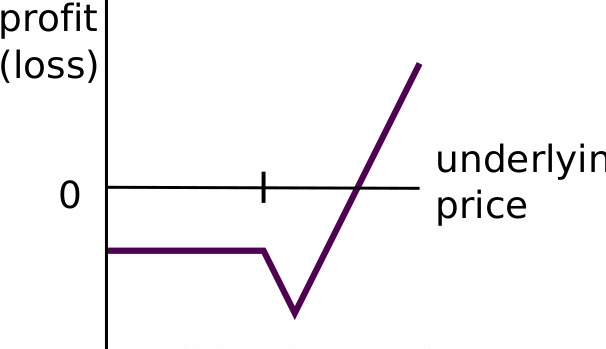
In the above diagram, the horizontal black line depicts the continuous changes in the Market price of the underlying asset. The vertical line is to show the corresponding Profit/Loss it would make for respective market prices.
The purple-colored line tells us exactly how the Profitability or Profit/Loss equation changed of the underlying stock with changes in market price. Line points below the Horizontal Line show Loss & Points above the Horizontal line Represent profit.
For a particular market price:
If the stock doesn't make any Profit or Loss, It is referred to as the "Break even Point" in Options Algo Trading. Always practice Looking at the P&L diagram of any Stock option before making a trade with your Options Trading App.
Explore More Graphs Click here
How Can You Benefit From "P&L Diagrams" in Options Trading?
P&L Diagrams help protect against 20 Mistakes That Won’t Let You Prosper In Stock Investing. For example - The current market price of a Stock is ₹1000. The option contract is expiring in 25 Days. The trader needs the spot price to reach at least ₹1,600 to make some profit.
Looking at the P&L Diagrams - Traders can easily get an idea of how much the price has to move in the Next 25 Days for him/her to make the trade profitable. Then He/She can set a sensible strike price for Selling the Stock.
Profit & Loss diagrams are widely used in Options algo trading. It will also help you with Option pickings. Some options can make you 200% profits with Relatively low price movements. Compare that to some other options available which will require a little too much price movement to make the same amount of Profit.
This way you can use P&L diagrams to Optimize your trades for maximum profits and also pick Options that can give you a Handsome amount of Profit without too many Price fluctuations required.